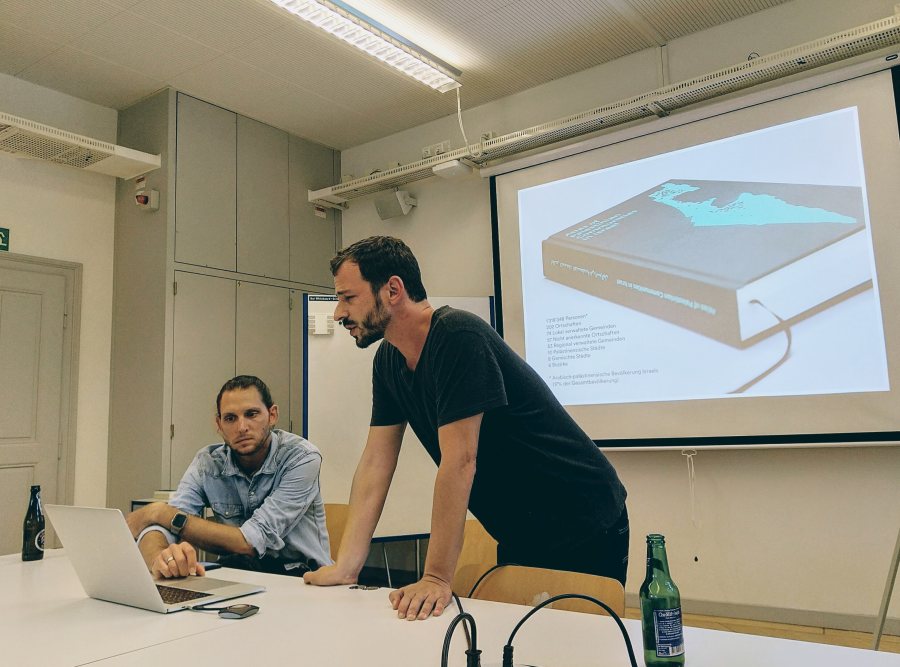
My talk on 27 June 2016 called “making machine-usable information also more human-usable” at the University of Bern for the 2nd meeting of the Data Visualization Group is available as online slides here. Thanks to Janik Endtner for the invitation.
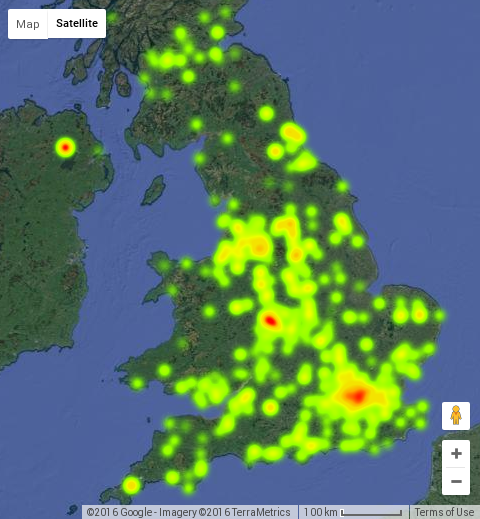
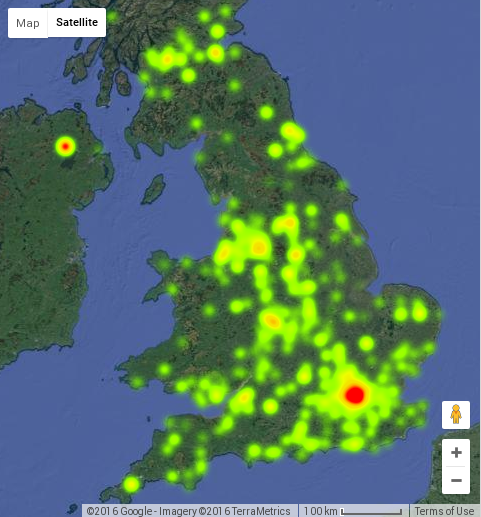
For the talk I imported and geocoded the #euref data in this Google Fusion Table.
References:
- Democracy, Demos (Wikipedia)
- Un/Conference Opendata.ch 2016
- Paul Signac: Les Diablerets, l’Oldenhorn ete le Bécabesson (Christies)
- Happy Land (BBC)
- EU Referendum Result data (The Electoral Commission)
- Brexit Areas and Demographics (The Guardian)
- Brexit in Five charts (Financial Times)
- EU Referendum Results (BBC)
- To Cartogram or not to Cartogram the Brexit (vis4.net)
- Lego map of the EU Referendum
- Food infographic of Brexit (@SSI_Deutschland)
In a future talk I’d like to go into more detail on the topic of intent + consequence, and explore these six keys to data literacy:
✓ source
✓ license
✓ link
✓ code
✓ logic
✓ context
To find out more about Open Knowledge visit okfn.org, and check out our project to start a School of Data in Switzerland.
The Swiss Open Cultural Hackathon takes place again in Basel this week. Later this month I’m running a course at SUPSI called Adventures in Data visualization.
“Oh God, the terrible tyranny of the majority. We all have our harps to play. And it’s up to you to know with which ear you’ll listen.”
― Ray Bradbury, Fahrenheit 451


