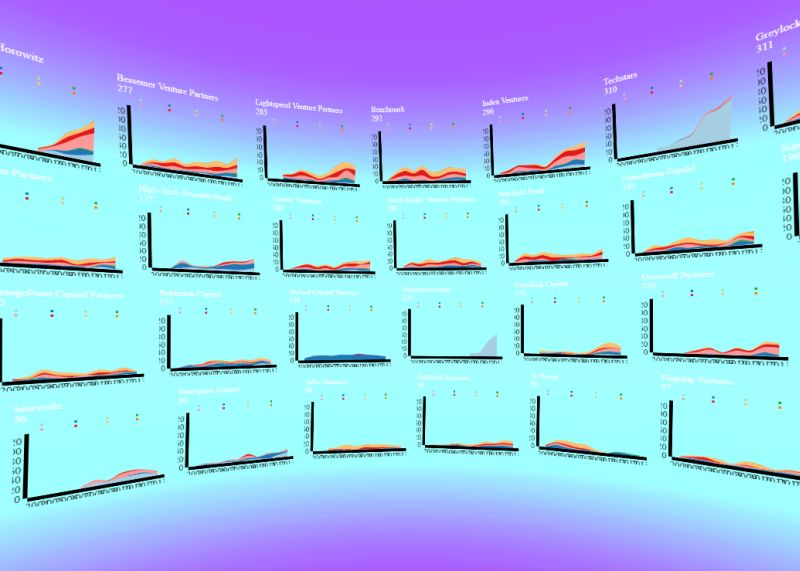
A recap of the workshop follows, including a sneak peek at a possible future in VR dataviz. Thanks again to everyone at SUPSI for their support and the chance to do this fantastic workshop together. Looking forward to what our participants are going to come up with next!
Following up on our spring open lecture, we partnered with the University of Applied Sciences and Arts of Southern Switzerland (SUPSI) on a five day creative skills workshop with a focus on open data and data visualization.
The 2016 edition of the workshop Adventures in data visualization aims to explore the field of Open Data. We will introduce a wealth of new information resources for creative investigation and exploration, such as open government data portals and cloud-based data aggregation tools. Participants will be introduced to the topic, obtain legal and technical grounding in open data, and access and manipulate on-line datasets to create their software or hardware projects.
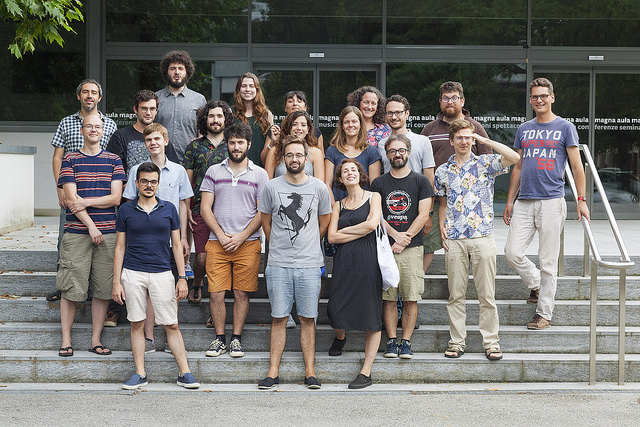
We were a group of ~20, kicking off the workshop amidst the stunning SUPSI campus in full summer bloom. The workshop’s organiser, Serena Cangiano, began by showing some of last year’s impressive results, bits and pieces of which lined the walls of the Fab Lab next door. Fabio Franchino (of TODO.to.it) began by introducing a brief history of visual communication, and the state of VIZ.WTF today.
Data Expedition
Our suggestion was to run a School of Data-style Data Expedition as a way of introducing participants into the datasets, portals, tools, and general attitude of open data research. I (Oleg) first introduced the class to concepts of open data, open source, and how data can be used from apps to activism - here are my slides.
Afterwards we ran the Data Expedition with four groups brainstorming project ideas and exploring data sets. Here are our aggregated Character Sheet stats in the same style (orange - high, 2-3, blue - low, 0-1) as our last #GLAMhack Data Expedition:

During the Expedition, Fabio and I tried to encourage people to think creatively, to shed their fear of venturing into the unknown by invoking some of the spirit of the Dungeons & Dragons role-playing games we enjoyed in younger days.

One of the teams asked to help find open data related to water visualisation. They later switched themes, but I posted the findings and briefly discussed the issues on our forum for future reference.
After sharing our “dragons” and “treasures”, most of which were documented in a set of Etherpads, we broke off in the evenings for pizzas and dives into the warm waters of the Lago di Lugano at dusk. A terrific start to the four intensive workshop days that followed.
Super-computing
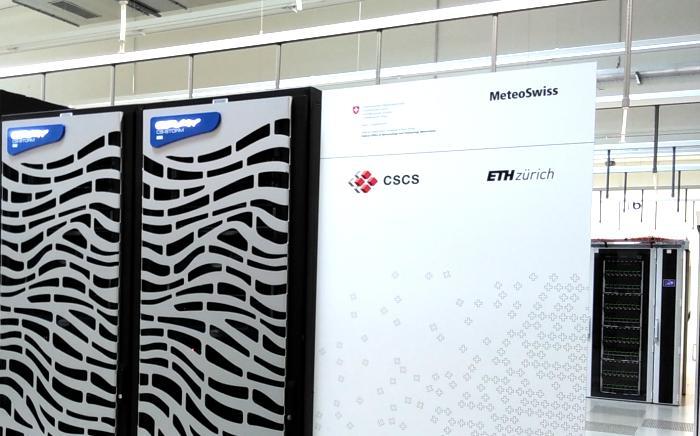
Day 2 of the workshop began with a riveting visit of the Swiss National Supercomputing Centre, where a specialist in data visualisation who works primarily with researchers on illustrating and animating the output of simulations, using tools like ParaView and the Python programming language. He talked us through the history and function of the facility, and was inspiring us in the possibilities of 3D data rendering with award-winning projects.
We learned about the work that goes on in understanding, interpreting and rendering data at the highest levels of academic and weather science, then toured the data center itself. Visit the CSCS website to learn more about their flagship Piz Daint & Piz Dora assemblies or the huge water cooling infrastructure in place, pumping water from the lake. Check their Annual Report to find out about the money spent and groundbreaking research accomplished.
Our class spent the rest of the day in the guidance of Fabio Franchino, learning about how to visualise CSV data in JavaScript with D3.js, everyone was very attentive and diligent in their practice of information visualization and animation. Towards the end of the day we got back to discussing the projects (and all the ways to visualise our ideas).
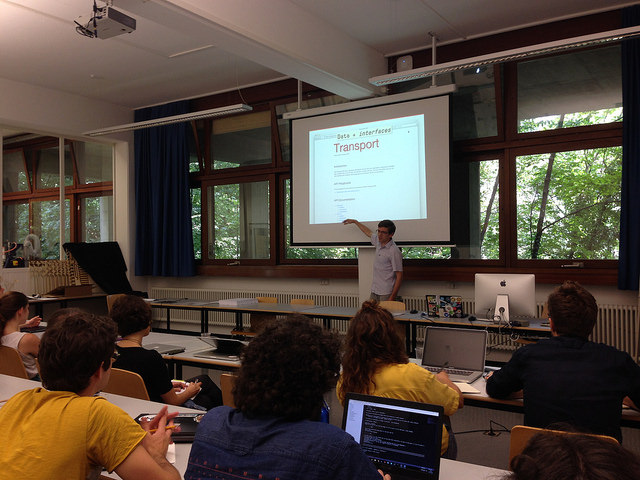
Photo by Serena Cangiano CC BY NC-SA 2.0
The next two days there were few interruptions or distractions, except for guest speakers from the OASI group of the Canton of Ticino and from sketchin, an interactive design company. Everyone seemed to know and keenly desire what they wanted to accomplish, and worked in earnest on their projects until late in the night.
At one point the participants asked us to do a brief break before lunch and go over some fundamentals that we maybe rushed a little at the start. With Fabio’s able guidance, we looked again at the way D3 works with the Document Object Model and browser events. I did a brief history of databases - from relational to NoSQL and APIs, see my notes on A Tiny History of Databases.

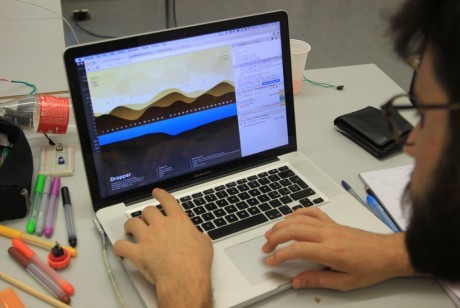


 today. I’m introducing the class to concepts of open data, open source, and how data can be used from apps to activism - here


