Excerpted study notes (see full part 1 and part 2) for my Open Data lecture at the Berne University of Applied Sciences, part of the Certificate of Advanced Studies in Data Analysis. The course of study is designed for professionals interested in data projects, building experience in the analysis of data using desktop tools.
The intent of this lecture is to present a practitioner perspective as well as some introductory background on open data, the open data movement, and several real-world projects - with details of the data involved, legal conditions and technical challenges.
No universally accepted standards for pallet dimensions exist. Companies and organizations utilize hundreds of different pallet sizes around the globe.
Last week, we started by considering how Attention to certain types of questions leads to virtuous cycles of data, information and knowledge, and how the opening of data activates this cycle. We covered Definitions of open data, as well as the various types of licenses, guidelines and publication standards involved. Then our focus was on Switzerland, the origins of the open data movement here and what opportunities and challenges exist here in regards to public and government data. After discussing the role of the Community in validating use cases, we learned how to publish open data ourselves in a Hands-on way, looking at what happens behind the scenes in open data portals and trying out some open source tools on datasets we researched together in class, producing a new Data Package.

Image from School of Data / R Consortium project
Continuing from this introduction, we did a run down of the mechanisms for using open data in the R environment. Specifically, we covered the CKAN API supported on opendata.swiss and compatible open data portals (of which there are reportedly thousands). With R scripts, we searched for and accessed live open data and visualized it directly in R Studio using the CKAN package.
Our discussion then centered on what makes a “good” open data project. We looked at some student and community projects, like the ones from the Open Data Vorlesung at the University of Bern and the make.opendata.ch wiki. The importance of proper attribution and references was discussed, as well as why it can be critical to include the code to update or aggregate data inside of the project (as the Openfood.ch Data Package does, for example) - as well as documenting clearly what the intended result of the visualization or app looks like for posterity.
Projects we looked at in depth included TransportFlows, Contaminated Sites and Open Budgets.
These hallmarks of open data development led us to launch into a mini-hackathon during the second half of the class, inspired by the make.opendata.ch events. We divided into teams of 3-4 people and took up roles (Expert - Designer - Developer), brainstormed and researched open data sources, and built rapid prototypes with a ticking countdown clock. About 45 minutes were spent on the whole exercise, which was followed by presentations and discussions of everything that was found - and, more interestingly, a hard look at the barriers which prevented teams from getting closer to the challenge they picked or using the data they wanted.
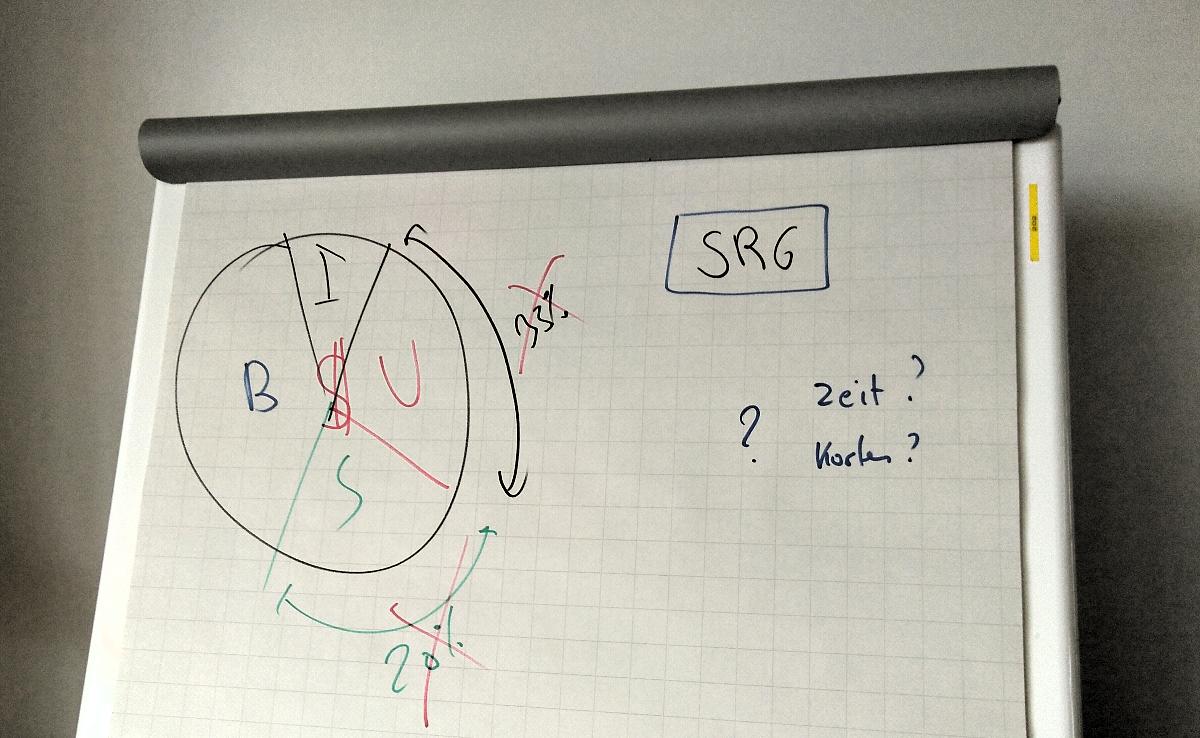
For instance, one of the teams wanted to visualise time series data, and we talked about interactive widgets in R Shiny that could make this easier to do. Another wanted to use new data from SRG RTS API published to support current debate in media reform, but ran into various technical issues. All the teams demonstrated a high degree of curiosity, ingenuity and collaborative skill.

Closing off, we talked about how open data fuels current innovative research and products in topics like Artificial Intelligence and the Internet of Things, with public datasets being provided as a starting point for Machine Learning, Natural Language, and Computer Vision applications.
This contest represents the first public release of a large amount of tracking data from professional tennis matches. A successful solution has the potential to revolutionize the way that tennis uses data science to collect match statistics and make a huge impact on the sport.“
– From AO to AI: Predicting How Points End in Tennis, Tennis Australia
As a teaser of Things to come, I demonstrated some data gathered and opened during the morning using a LoRaWAN-connected sensor node broadcasting to an open-access gateway on The Things Network maintained as part of a BFH project. We talked about how such real-time data applications (Make Zurich) were being developed by new and rapidly growing communities dedicated to open networking, and how crowdsourced data goes hand-in-hand with efforts to make sense of (R User Group Zürich) official open data.
Many thanks once again to all of the students who enthusiastically took part in the module, to the BFH staff and my fellow teachers of the CAS. I’ll be following your progress and projects, and ready to answer any questions here.
