This post was written for a data visualization workshop: https://blog.datalets.ch/021/
One of the teams at Adventures in Data Visualization 2016 asked to help find open data related to water visualisation. They then switched themes, but I thought I would post the findings and briefly discuss the issues here for future reference.
They wanted to collect information about tap water and compare it to bottle water consumption. They began by looking up open data from the US 1 2, Italy 1 2 3, Switzerland 1 2 3 4 and worldwide 1 2 3 4.
I put together several of the open geo-datasets together on a GeoAdmin map - water quality measures:
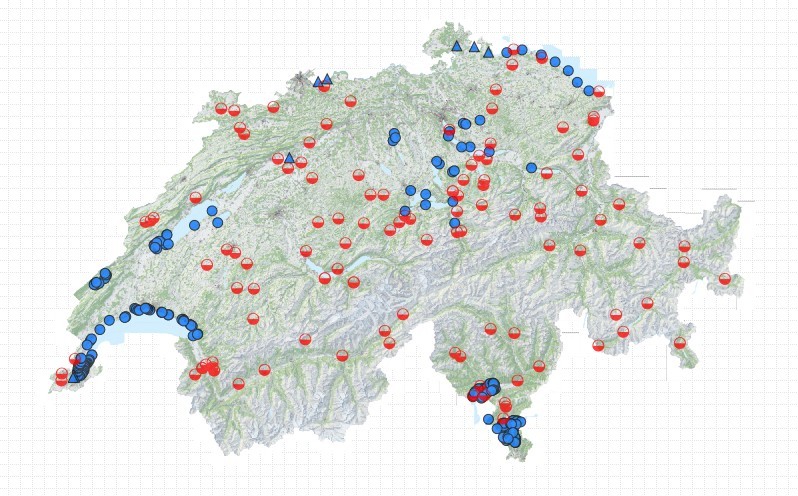
And all 20000+ tap water collection sources:

They were particularly interested in the last one, and I started pulling the data through the open WMS service into QGIS Desktop, which looks like this:

Unfortunately, limitations in QGIS prevent working with data from WMS in the form of vectors, which made it difficult to extract a list of locations - which you would need, for example, for distance comparison. One option was using OpenLayers and GeoAdmin’s REST API, however that presents additional technical barriers. Another option was using another GIS package, but again that means time/costs.
We did ultimately find comprehensive open data in SQLite format from the Federal Office for the Environment, but by then the team had already decided that wrangling this kind of geodata was a bit over their heads, and changed topic. The experience brings home once again to me that roving the data dungeons, even with excellent resources like opendata.swiss, requires foundational training, good support, and experience with tools. School of Data FTW!
If anyone has an interest to continue on this topic, please feel free to chime in.