Virtual Reality will be filled with adventurous data this summer at SUPSI, the design and engineering school with whom we ran a program last year.
Check out the full program at maind.supsi.ch, sign up, and follow this thread for updates!
Virtual Reality will be filled with adventurous data this summer at SUPSI, the design and engineering school with whom we ran a program last year.
Check out the full program at maind.supsi.ch, sign up, and follow this thread for updates!
Notes from my introductory talk (which began with this demo - look around and double tap on things):
Having an amazing time here! Tweet coverage by fellow participants:
https://twitter.com/profeta_g/status/884390514988134402
https://twitter.com/AnderTave/status/884454201836937216
https://twitter.com/AnderTave/status/884497039454855169
https://twitter.com/profeta_g/status/884722772257243136
https://twitter.com/AnderTave/status/884777179946602497
https://twitter.com/AnderTave/status/884779185767686144
During the workshop, I read up on A-Frame, a „web framework for building virtual reality experiences“ released a few months ago by Mozilla, and started to put together a visualisation based on Swisstopo and OASI data (details here).
The basic idea as proposed at the workshop on Tuesday, was to experiment with the way we understand and form memories of abstract shapes, such as the ones formed from 3D data visualisations. I would like to explore an environment and datasets in virtual reality, while simultaneously holding a printed model of the data in my hand.
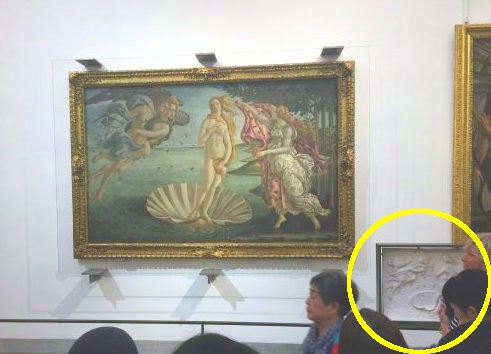
This is similar to the way the plaster version of The Birth of Venus at the Uffizi gallery in Florence allows not only visually impaired persons to appreciate the artwork, but also gives an altogether different perspective on the work through the combined feedback of visual and tactile senses.
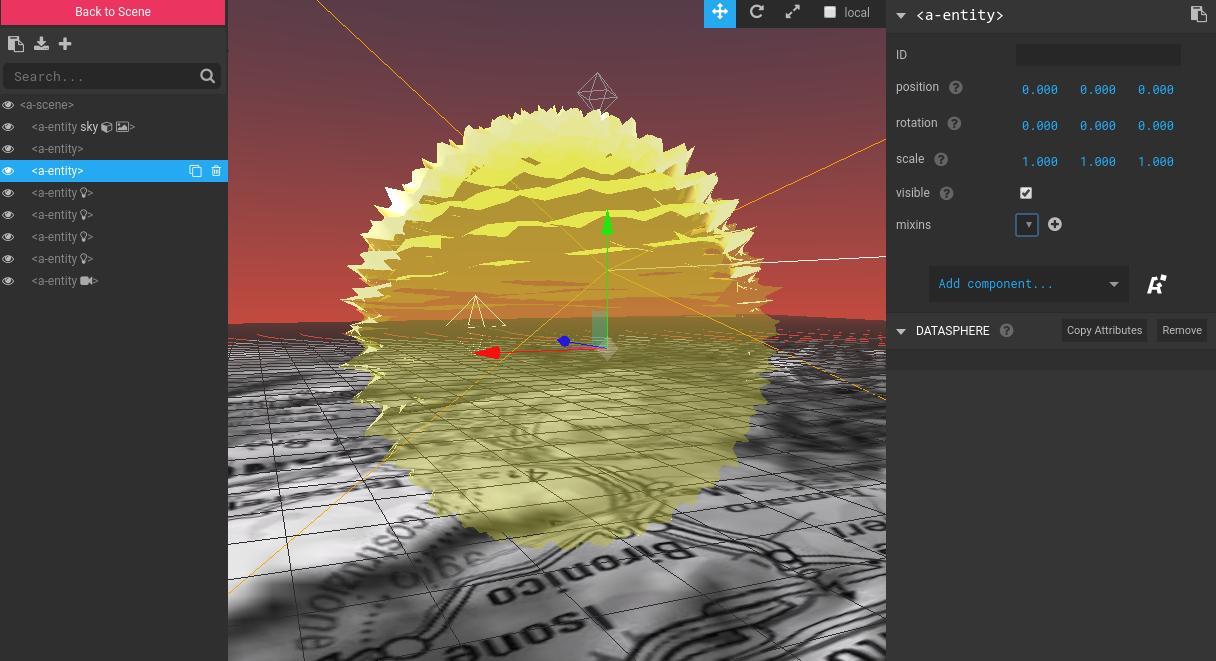
A few hours of tinkering with custom entities, making good use of the A-Frame scene explorer:
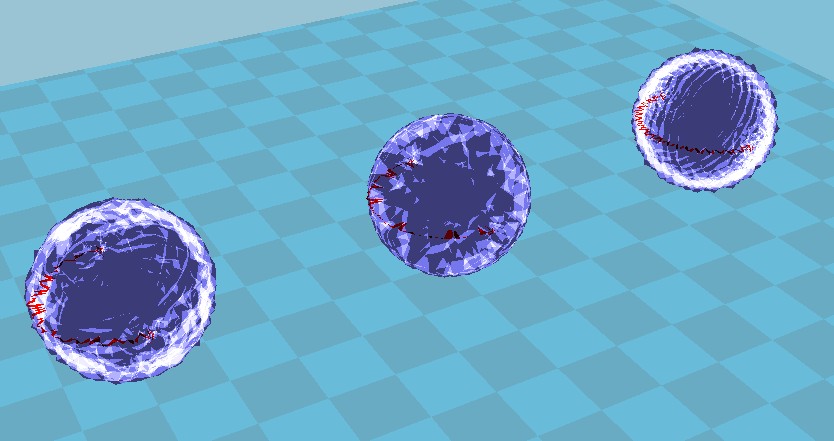
… resulted in this initial visualisation of the „shape“ of traffic (blue), noise levels (green) and temperature (yellow):
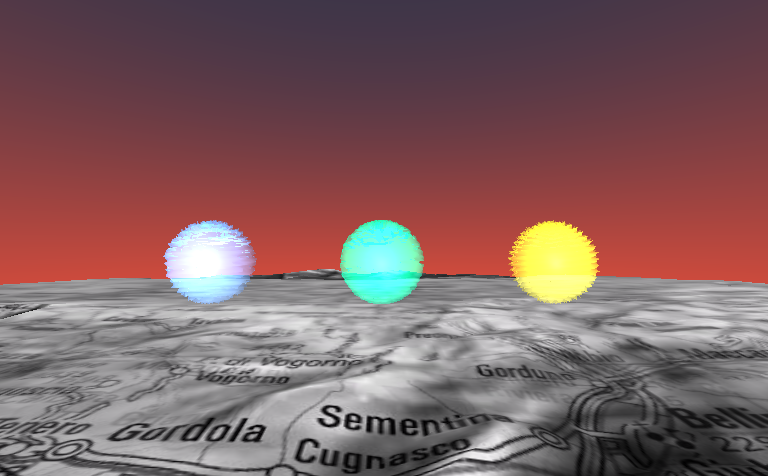
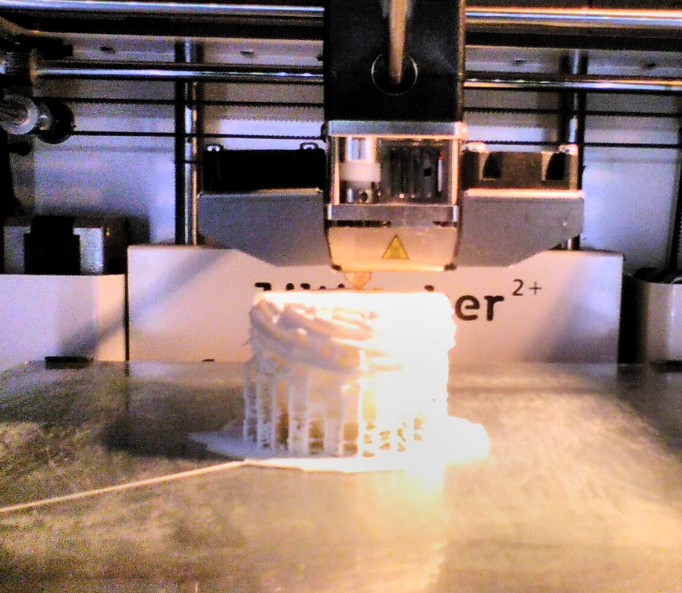
… which can be exported to STL for 3D printing in programs like Ultimaker Cura:
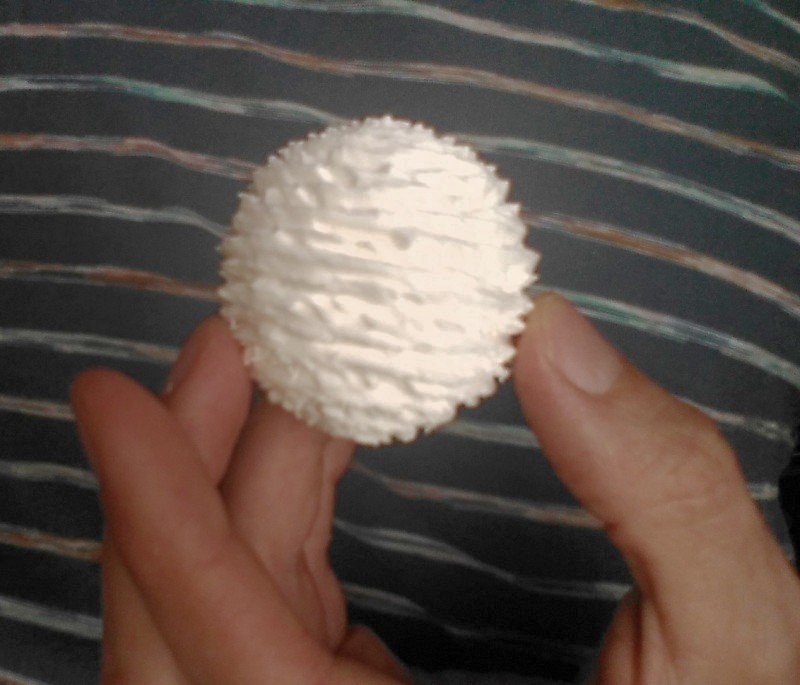
… the physical datasphere then looks like this (thank you Fab Lab Lugano and Fab Lab Bern for support!):
You can preview the piece, clicking on the goggles at the bottom right to enable VR mode: D E M O
Still plenty to do:
Tantalizing previews of projects realized by the group:
https://twitter.com/AnderTave/status/885177454054305793
https://twitter.com/gretacastellana/status/885176258505711617
https://twitter.com/gretacastellana/status/886899351313940481
See the full #ADV17 tag and Andreas collection on Twitter for more.
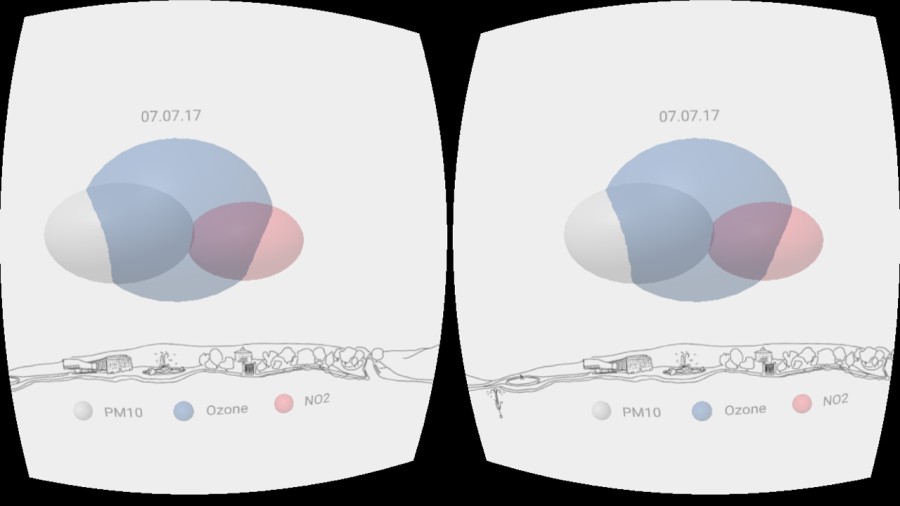
In their project posted online, Carola Bartsch and Sandro Pianetti used stylized clouds to make air pollution data perceivable through animation and sound, with a sketched background representing the skyline of Lugano.:
We are encouraged to try out and contribute to the openly hosted #ClimateSextant project by Andrea Taverna and team, tackling issues of invisible pollution:
Project “Folding” by Greta Castellana and Michele Castelletti makes traffic statistics into an inception on the mind:

User testing was clearly a fun and essential part of this workshop!..
See you aVRound 